Now that we’ve looked at some basics for writing HTML/JS apps in Windows Phone and we’ve looked at an example of initiating the camera, we’ve probably hit a snag where we need to do some debugging.
Here we have some good news and some bad news surrounding HTML/JS apps and Windows Phone.
The Bad News
The bad news is that, because our apps are running in the browser, we can’t attach a Visual Studio debugger to them, so we can’t use Visual Studio as our debugging tool.
The Good News
There is a really easy way to tweak javascript debugging so that we can use it effectively with Visual Studio. From the javascript side, we just need to add these tiny lines of code:
var console;

if (window.external) {
    console = {};
    console.log = function (message) {
        window.external.notify(message);
    }
}
Now, whenever we call console.log, whatever message we give there will be sent to the C# component of our application. All we need to do now is catch this message in the C# and do something with it. We’ve probably already set our WebBrowser to enable scripts and listen for our script notifications:
<phone:WebBrowser x:Name="Browser"
            IsScriptEnabled="True"
            ScriptNotify="Browser_ScriptNotify" />
Once we have this in place, we can listen to all our console.log messages in the Browser_ScriptNotify event handler and set break points there.
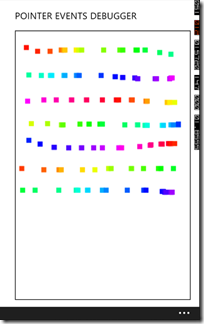
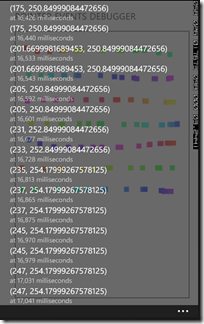
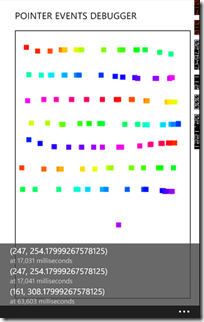
To demonstrate this a little more powerfully, I’ve built an application that listens for pointer events on an HTML5 canvas and sends those events to a list we can pull up in our application.
Download debugging sample project
Fork on github for HTML/JS Windows Phone Tutorials


Thanks rely helpful 🙂